Monitor Performance
Monitor Performance
This section will monitor the performance of STG326 - SAZ.
Note
It will take approximately 15 minutes to complete this section.
CloudWatch dashboard
Important
Read through all steps below and watch the quick video.

-
Open the Amazon CloudWatch console.
Tip
Context-click (right-click) the link above and open the link in a new tab or window to make it easy to navigate between this lab tutorial and AWS console.
-
Select Dashboards from the left navigation pane.
-
Select the link of the dashboard created as a part of the tutorial environment.
Tip
- The name of the dashboard should be the region name (e.g. us-east-2), dash (-), file system id of STG326 - SAZ (e.g. us-east-2-fs-0123456789abcdef).
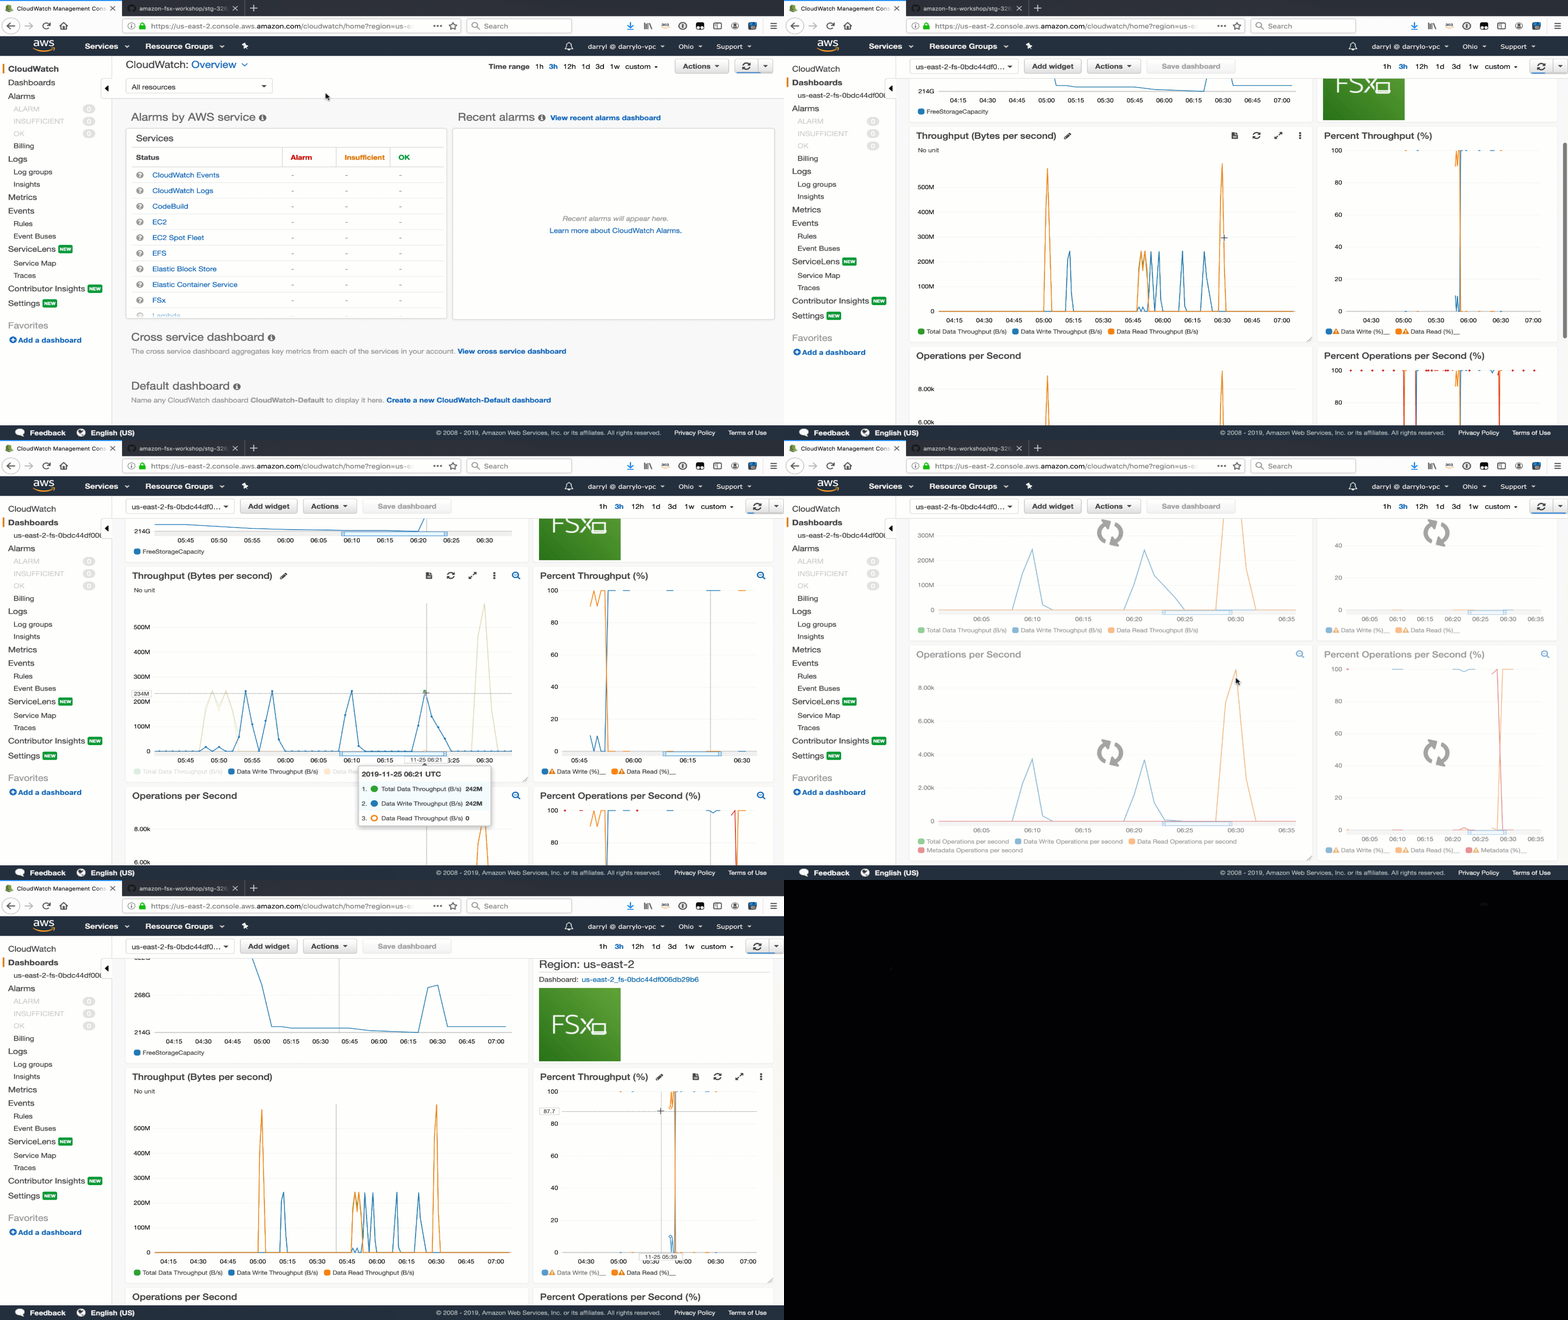
- Scroll through the dashboard and review all the widgets and their settings.
- Notice how the vertical time line is in sync across all widgets. This makes it easy to correlate different metric values for a given point in time.
- Zoom in on a widget by clicking and dragging over a period of time. Notice all widgets also zoom in for the period of time selected.
- Reset zoom by clicking the blue magnifying glass in the top right of any widget.
CloudWatch alarm
Important
Read through all steps below and watch the quick video before creating the alarm.

-
Copy the file system id from the top right dashboard widget.
-
Click the Maximize button of the Throughput (Bytes per second) widget.
-
Click the View in metrics link (at the bottom left of the window).
-
Find the metric labeled Total Data Throughput (B/s) and click the Create alarm button (bell icon) in the actions column.
-
Scroll down to the Conditions section. Accept the default Threshold type and Greater alarm condition and in the Define the threshold value field enter 200000000. This will set an alarm condition that will trigger if the Total Data Throughput (B/s) is greater than 200 MB/s.
-
Click Next.
-
Click Create new topic.
-
In the Create new topic… field, enter High_Throughput_ then paste the file system id.
-
In the Email endpoints that will receive the notification… field, enter an email address that you have access to right now.
-
Click Create topic.
-
Click Next.
-
Give the alarm a name like High_Throughput_ then paste the file system id.
-
Click Next.
-
Scroll to the bottom and click Create alarm.
-
The email address you entered earlier will receive an AWS Notification - Subscription Confirmation email. Open the email and click Confirm subscription.
-
Wait a few minutes for the alarm state to transition from Insufficient data to OK.
-
Return to the previous workshop section Test performance and Runa few more read and write performance tests against the file system. Make sure the duration of the test is at least 2 minutes.
-
Did your High throughput alarm get triggered?
-
Did your email address receive an alarm notification?
-